
We previously mentioned that an algorithm is nothing more than a set of instructions that are followed to perform a particular task. However, a list of instructions is not always the best way to represent it, since not all tasks can be executed linearly. Put another way, not all tasks can be executed step by step. Some algorithms require the instructions to follow different paths or even be executed at different times.
So, let’s explore a more appropriate way to design these algorithms that don’t necessarily execute linearly.
Decision making
A task list is not the most appropriate way to represent hypothetical situations where we choose between different paths, as in the card algorithms. Sometimes we needed to check if there were changes in the sorting or if the middle card was greater or less than the card being searched for.
For these cases, a flowchart is more useful for visualizing the decisions that can be made. Let’s see how this type of diagram is used to represent such algorithms.
Flowchart components
The interesting thing about flowcharts is that they have a standardized definition. This means there are very clear rules about how to define and use it in the industry, specifically ISO 5807, published in 1985, but last reviewed in 2019.
Popular basic shapes
Although we’re not going to cover all the basic or additional shapes, we will describe the most popular ones. With these, we’ll be able to represent most algorithms that involve decision making.
Flow line
It’s represented with a line (or arrow if necessary) and indicates the flow of the algorithm, in other words, the path we’re going to follow. The lines connect one shape to another, starting from one and ending in another.
Terminal
They are represented with a rectangle with rounded corners (stadium shape) and are used to indicate the beginning and end of an algorithm. This way we’ll have clear where to start and where it ends.
Decision
They are represented with a diamond and indicate a condition that usually has two options, generally Yes / No. This means that from the diamond there are always two flow lines where each line represents the decision taken by where the algorithm continues. It’s the same as when we find a path that forks and then we must decide which way to continue.
Process
It’s represented with a rectangle and represents an operation that generates a change in the algorithm. This is where we represent the logic or operations that we’ll be doing in our algorithm, similar to how we’ve been doing it in the task list.
Algorithm in a flowchart
To better understand how to create flowcharts, let’s solve a classic problem called “FizzBuzz”.
FizzBuzz problem
Write a program that prints numbers from 1 to n, taking into account the following way:
- For multiples of 3, print “Fizz” instead of the number.
- For multiples of 5, print “Buzz” instead of the number.
- For multiples of both 3 and 5, print “FizzBuzz”.
For example, the first 15 numbers would be: 1, 2, Fizz, 4, Buzz, Fizz, 7, 8, Fizz, Buzz, 11, Fizz, 13, 14, FizzBuzz.
📝 n would be an integer, for example the number 100, in that case numbers from 1 to 100 would be processed.
I recommend that you try to write the solution in pseudocode list form as we’ve done in the card algorithms.
FizzBuzz solution
Next, let’s see step by step what would be a solution to this problem using a flowchart.
ℹ️ The numerical annotations in the flowchart are only for educational purposes. A flowchart usually doesn’t come with extra notes or a step-by-step description, since it’s considered that the diagram itself is more than enough.
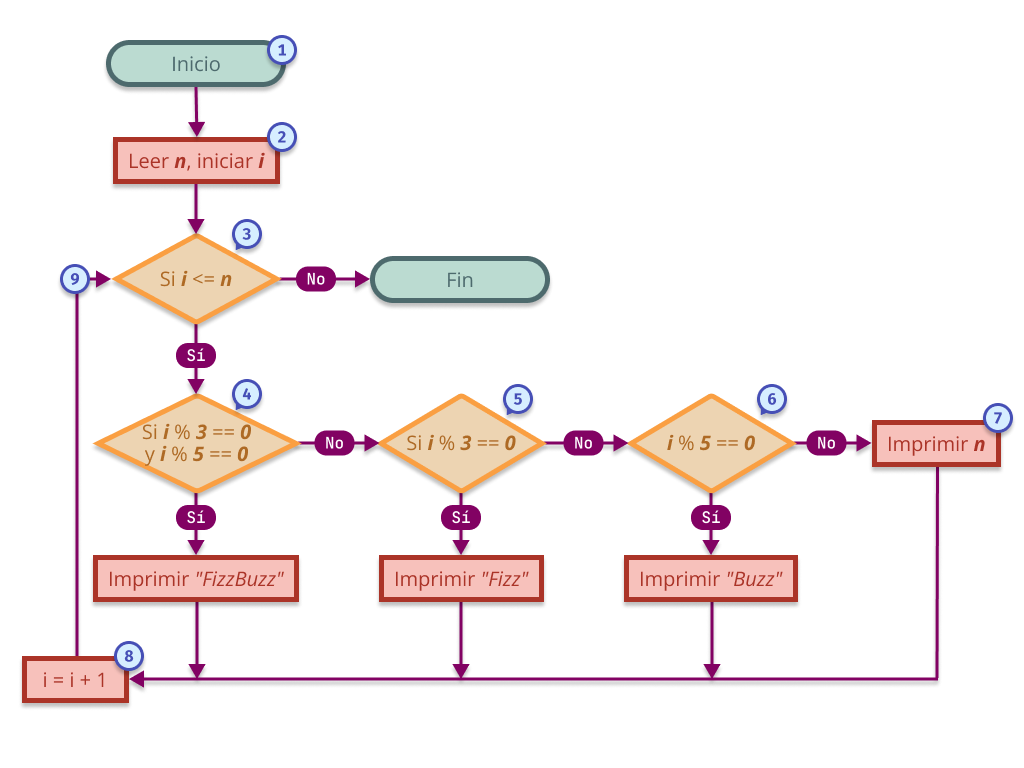
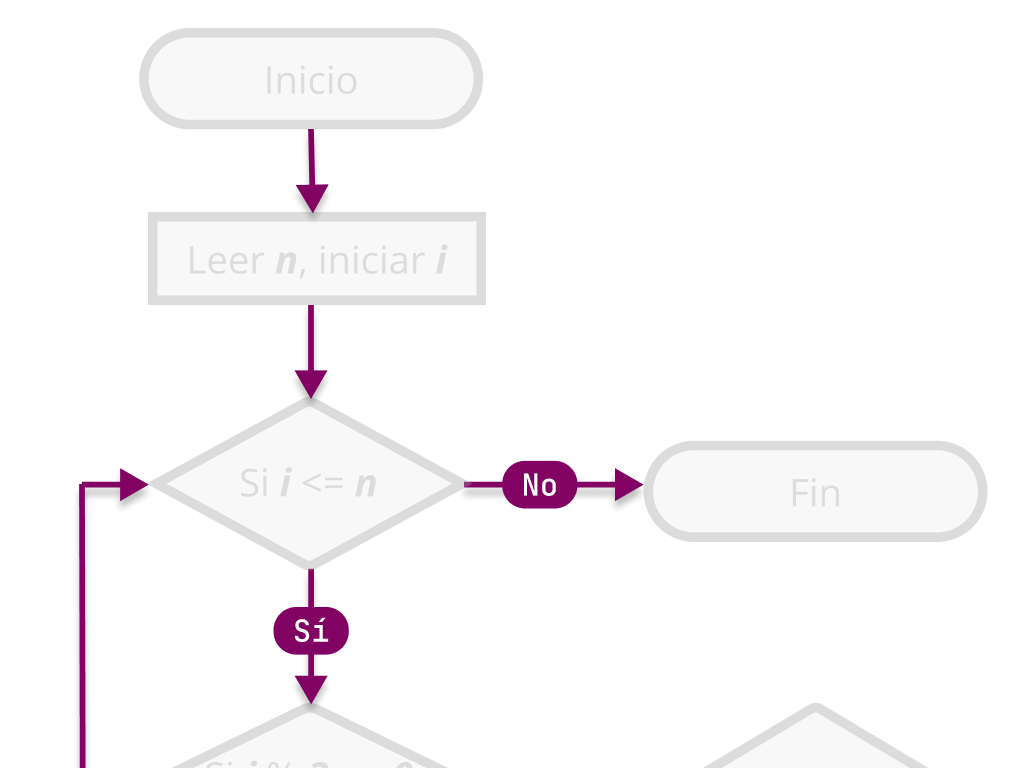
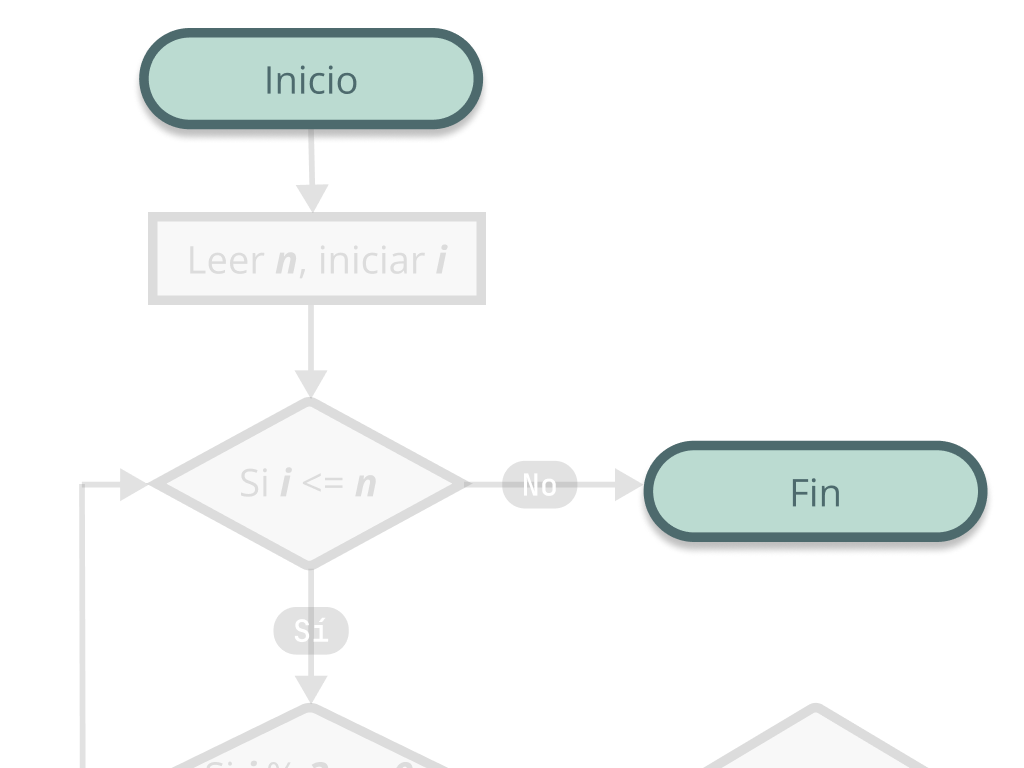
- We locate the “Start” Terminal, which for convenience is at the top. This is where the algorithm begins. We follow the arrow down.
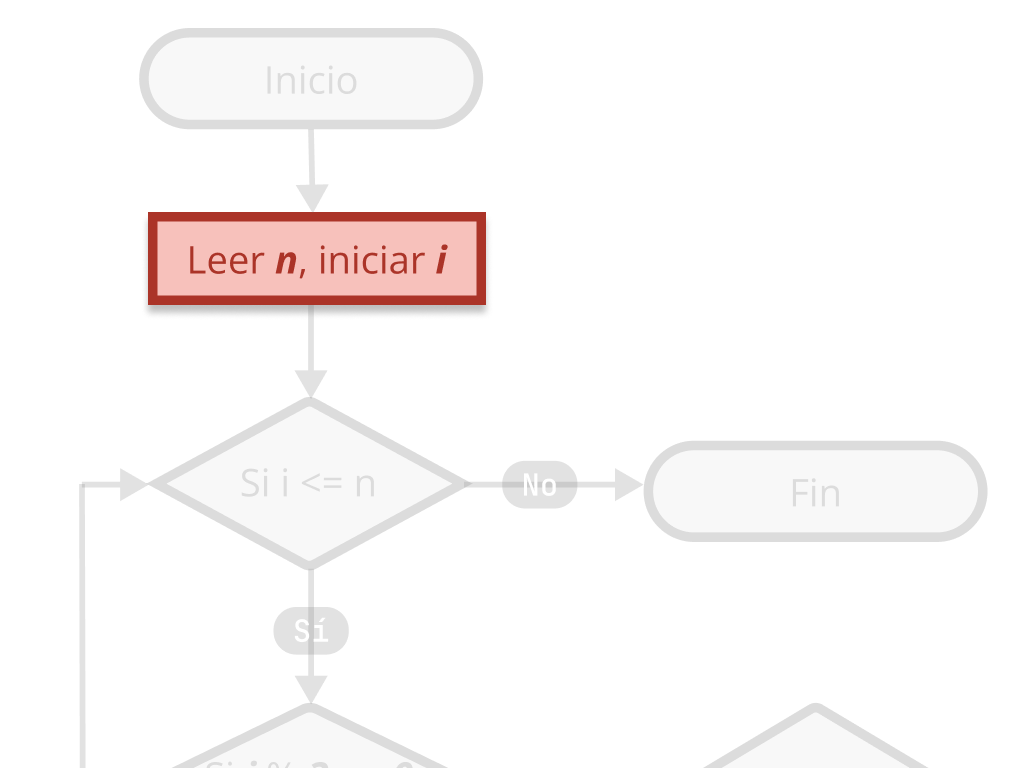
- We encounter our first Process: Read n, initialize i. This means that the user must enter up to what number we’re going to count (for example,
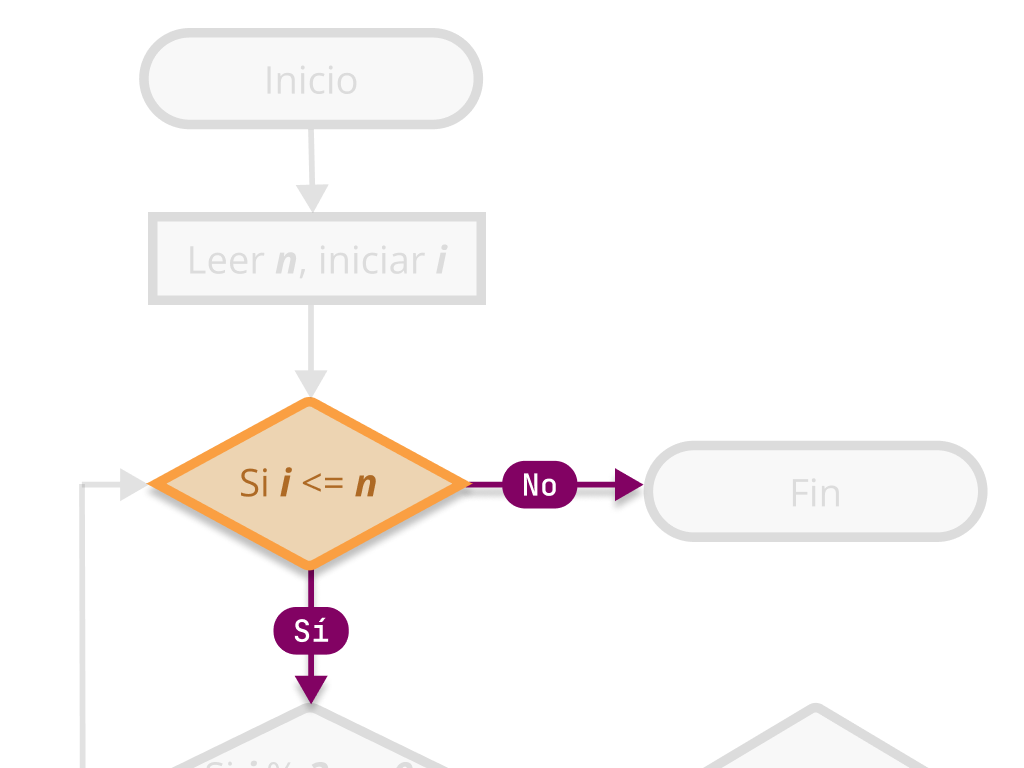
n = 100) and that we initializei = 1. We advance following the arrow. - We reach the first Decision, where we ask ourselves: Is i less than or equal to n?
- Yes: We continue with the algorithm flow. Since in this case
i = 1andn = 100, the condition is met. - No: The algorithm would end and we would go directly to the “End” terminal. (This is not the case).
- Yes: We continue with the algorithm flow. Since in this case
- Continuing along the “Yes” path, we reach another Decision, where we ask: Is i divisible by 3 and by 5? That is,
i % 3 == 0andi % 5 == 0.- Yes: We would print “FizzBuzz”, and then go to the increment process.
- No: We continue to the next decision. In this case, since 1 is not divisible by either 3 or 5, we continue.
- In the next Decision, we ask: Is i divisible by 3? That is,
i % 3 == 0.- Yes: We print “Fizz”, then increment i and return to the first decision.
- No: We continue to the next decision. Since 1 is not divisible by 3, we continue.
- We advance to the third Decision of this block: Is i divisible by 5? That is,
i % 5 == 0.- Yes: We print “Buzz”, then increment i and return to the cycle.
- No: Since 1 is also not divisible by 5, we take this route.
- Since i didn’t meet any of the previous conditions, we reach the final Process of the decision block, where we simply print the number i. In this case, we print the number 1.
- After printing, we reach the increment Process: Here
iis updated toi + 1, that is, nowi = 2. - Finally, we return to the main control point (the decision
i <= n) and the cycle repeats with this new value.
Not everything can or should be a flowchart
Almost all algorithms written in pseudocode as a list can be represented in a flowchart. But if such algorithms don’t have a decision to make, perhaps the best way to represent them would still be the list as it was, following a bit the KISS principle.
😘 The KISS principle (Keep It Simple, Stupid) is a principle against over-engineering. Most of the time the simplest solution is the best solution.
On the other hand, there are algorithms that, in addition to having decisions, also execute processes at different times and in that case a flowchart can be used to represent part of it, but it requires other visualization methods to better represent its overall framework functionality.
Parallel instructions
Taking as an analogy the process of following a cooking recipe, those of us who have cooked a couple of times know that it’s better to read the entire recipe first to understand what can be done in parallel (at the same time).
🤖 For what humans may seem natural to take advantage of time and do certain tasks while others are being processed, for machines this can be a bit more complex and it’s not how it usually works by default. Parallelism and asynchrony in computing is a whole field of study.
Maybe, while the burgers are grilling, we could chop the onion or toast the buns: this allows us to save time since we don’t have to wait for something to finish completely to start working on the next task.
Although we’re not going to focus on explaining parallelism in this chapter, what I want to highlight is that a list of instructions may be insufficient to describe an algorithm, since sometimes it’s necessary to execute multiple tasks at the same time.
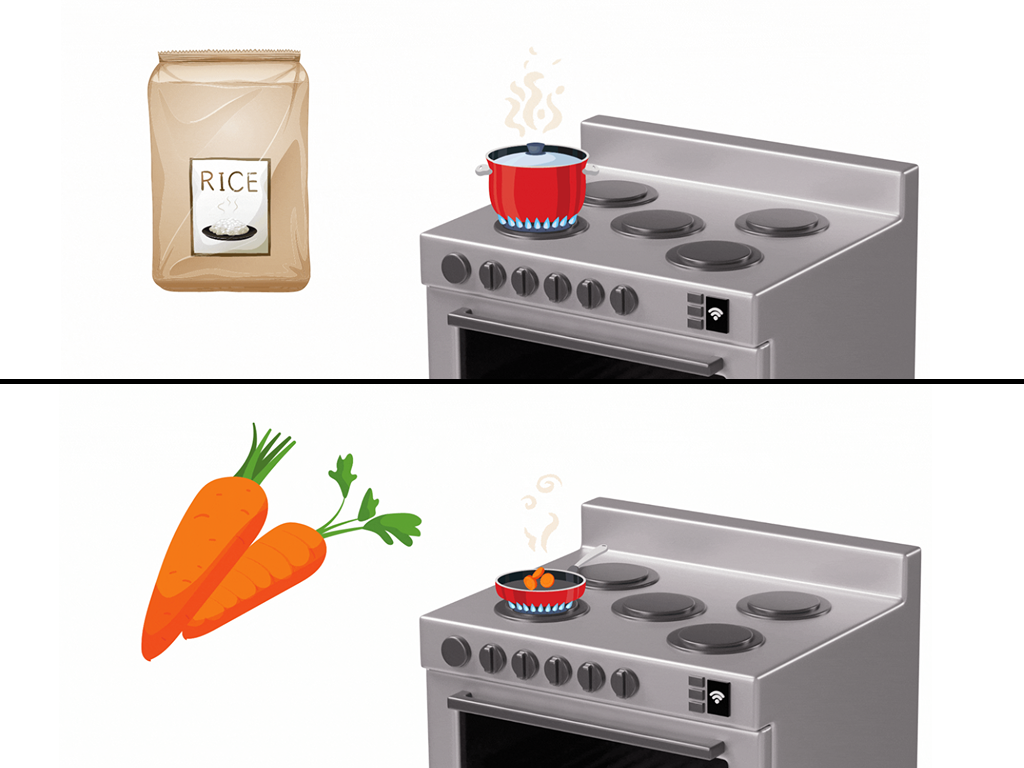
Cooking synchronously
Let’s cook synchronously a rice with chopped and roasted carrot. I know it’s not the most exquisite dish, but sometimes you have to eat healthy. 🌱
⚠️ We’re not going to focus on the recipe details, we simply want to contrast two ways of preparing the same thing: one slower, another more efficient.
One step at a time
Imagine you only have one burner available, and you can’t do more than one thing at a time. So we cook step by step.
- We put the rice to cook in a pot. This takes about 15 minutes.
- When it’s done, we let it rest for about 5 minutes.
- Once the rice is ready, we cut the carrot into slices.
- We roast them in a pan with a little olive oil for about 5 minutes.
- We serve the rice with the roasted carrots.
⏱️ Total preparation time 25 to 30 minutes.
Cooking asynchronously
Now let’s make exactly the same recipe, but using an asynchronous approach. That is, we’re going to do several things at the same time. Imagine we have more burners, or we simply organize ourselves better to not waste time.
🍚 If you’ve never made rice, it’s good to know that it takes about 20–25 minutes total, but only requires your attention during the first 5 minutes. The rest of the time is cooking and resting, so you can do other things in the meantime.
Taking advantage of time
This time we’re going to have multiple burners, which allows us to do more than one thing at a time. So we’ll cook more efficiently.

- We put the rice to cook in a pot. This takes about 15 minutes.
- While the rice is cooking, we take a carrot and cut it into slices.
- Then, we heat a pan with a little olive oil and roast the carrot slices for about 5 minutes.
- When the rice finishes cooking, we let it rest for about 5 minutes.
- By that time, the carrot will already be ready, so we just need to serve the rice with the roasted carrots.
⏱️ Total preparation time 20 to 25 minutes.
Sequence diagram
So far we’ve represented algorithms with lists and flowcharts, and that works well until tasks that don’t execute in strict order come into play, as we saw with the asynchronous recipe.
In those cases, where some instructions execute at the same time or depend on others that haven’t finished yet, a sequence diagram can help us better understand what happens, when, and who does it.
This type of diagram is more commonly used to show communication between different systems or components, for example, between a browser and a server. But it can also be useful for visualizing the sequence of events in an asynchronous algorithm.
🔁 It’s read from left to right (who participates) and from top to bottom (in what order things happen). The arrows indicate messages between participants, like when a cook puts something to heat, waits, and meanwhile does something else.
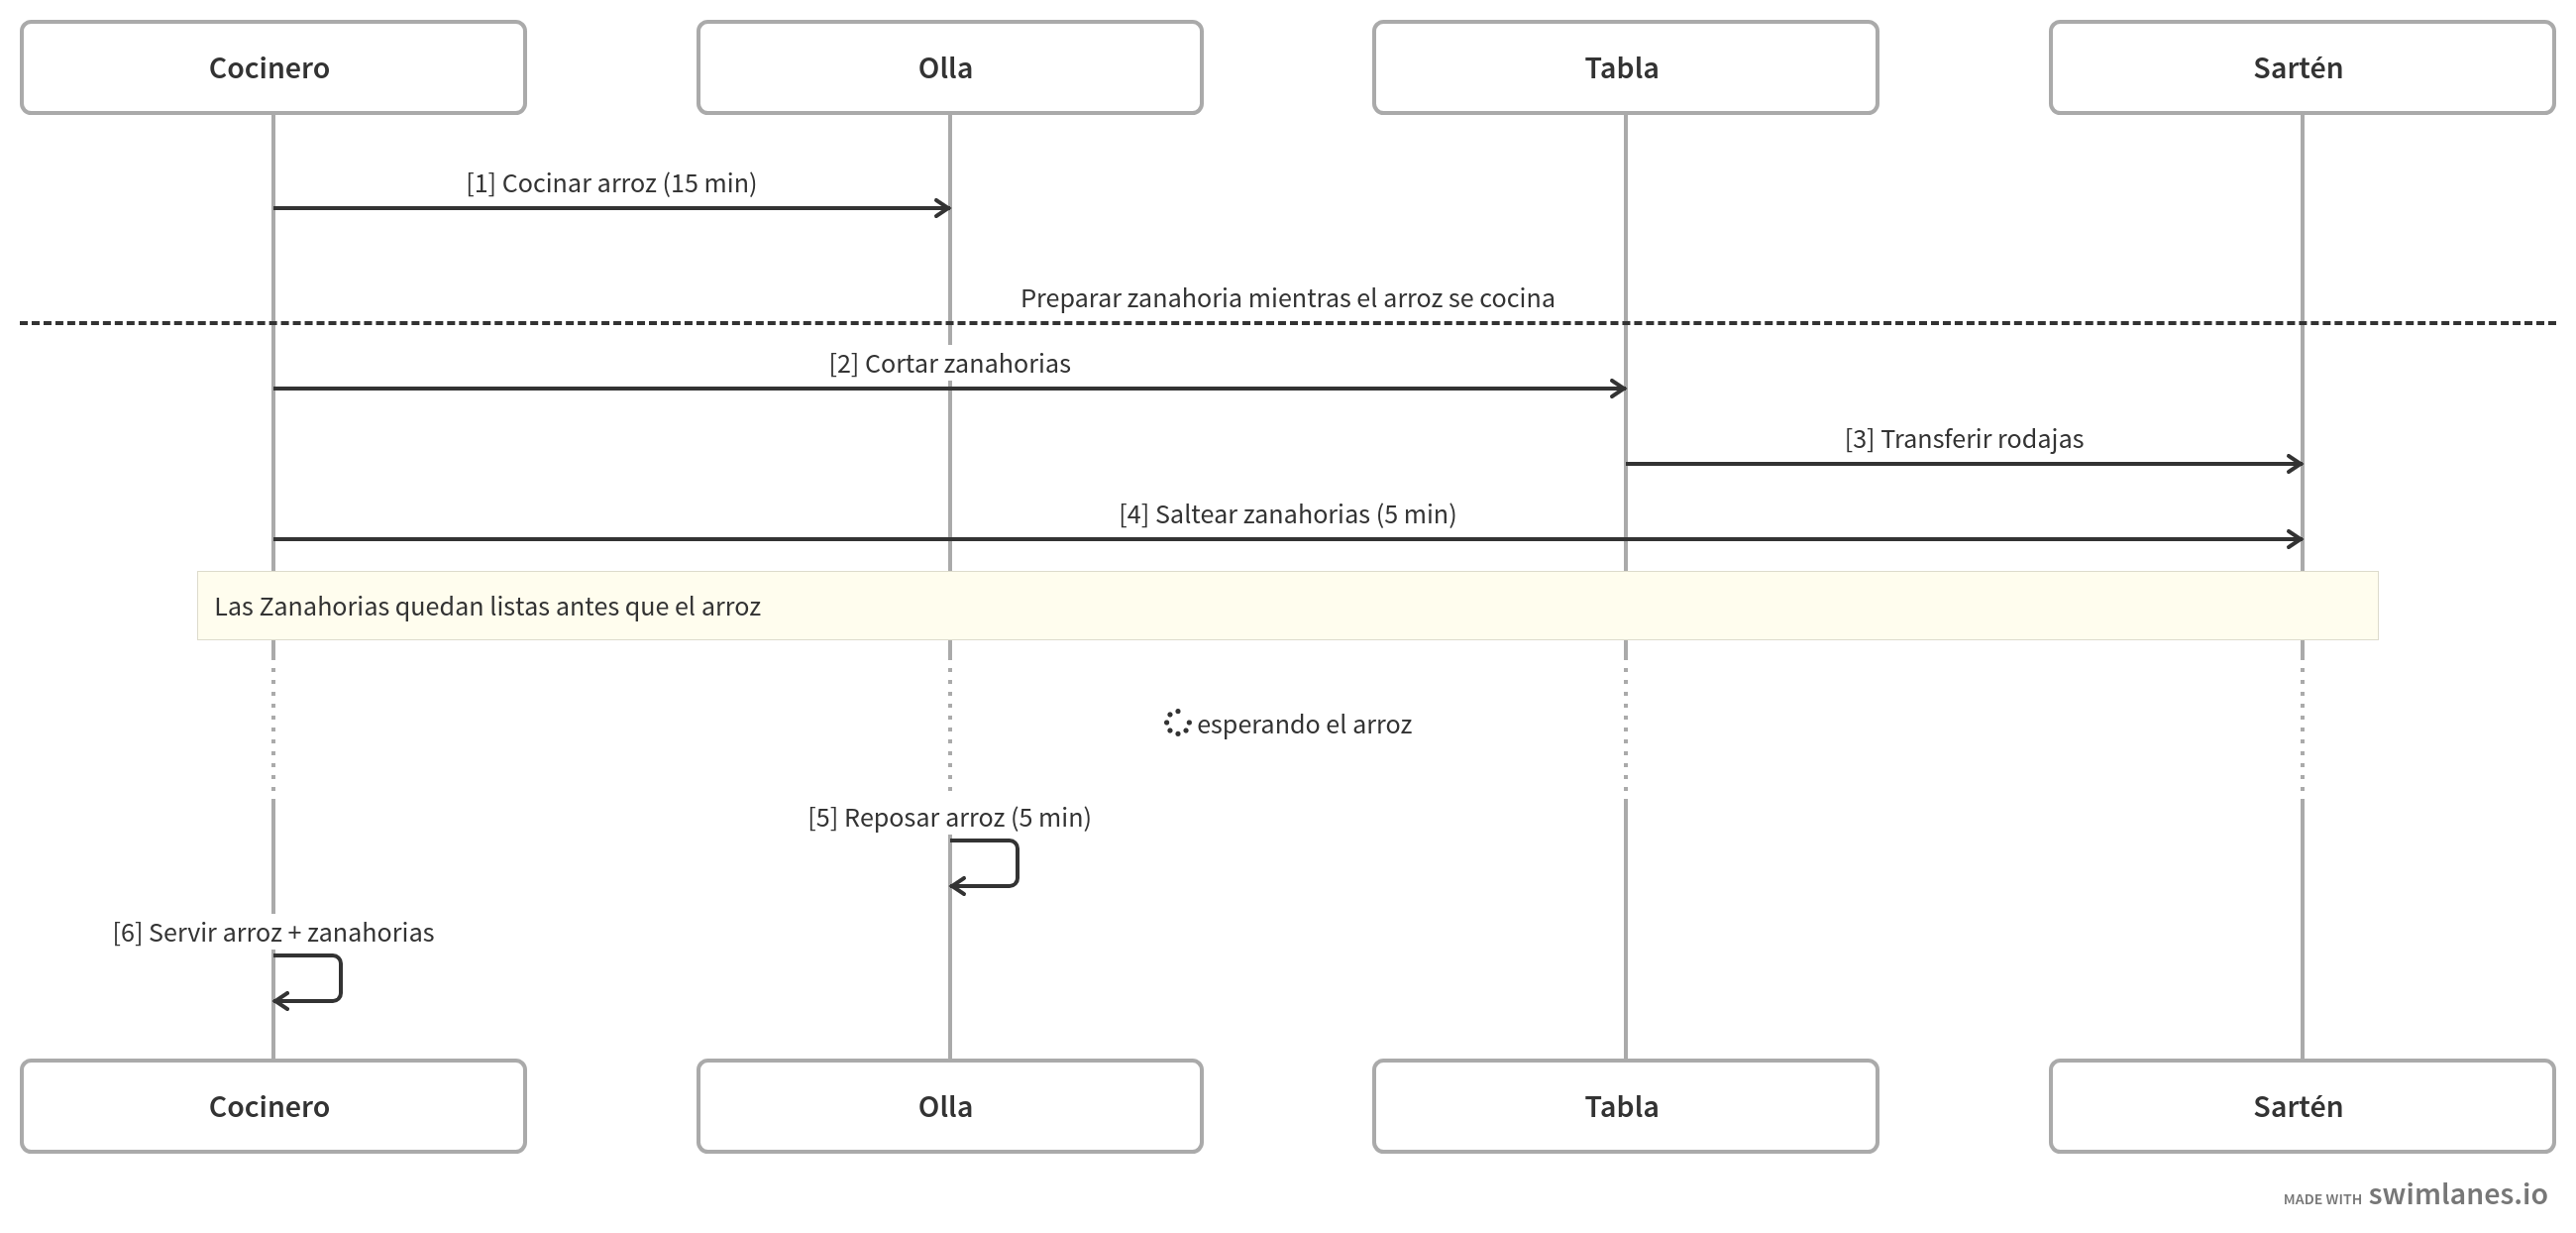 🔗 See the diagram at swimlanes.io
Later we’ll see concrete examples from the programming world, like the client-server flow. But, for now, we use this resource to better represent what happens in our recipe, and thus visualize clearly what it means to execute tasks in parallel.
Diversity in algorithm visualization
In programming, there are various visual ways to represent algorithms. I highlight some that are always useful: Flowcharts, to show decisions and branches; Sequence diagrams, to understand the order and interaction between components; and Entity-Relationship diagrams, when we work with databases.
Choosing the appropriate visualization not only helps to better understand the algorithm, but also makes it easier to explain it to other people. And although not all problems require visualization, knowing that you have these tools at hand can make the difference between seeing code as a step-by-step recipe or as a treasure map with clear instructions to reach the result you’re looking for. Arrggg! 🏴☠️